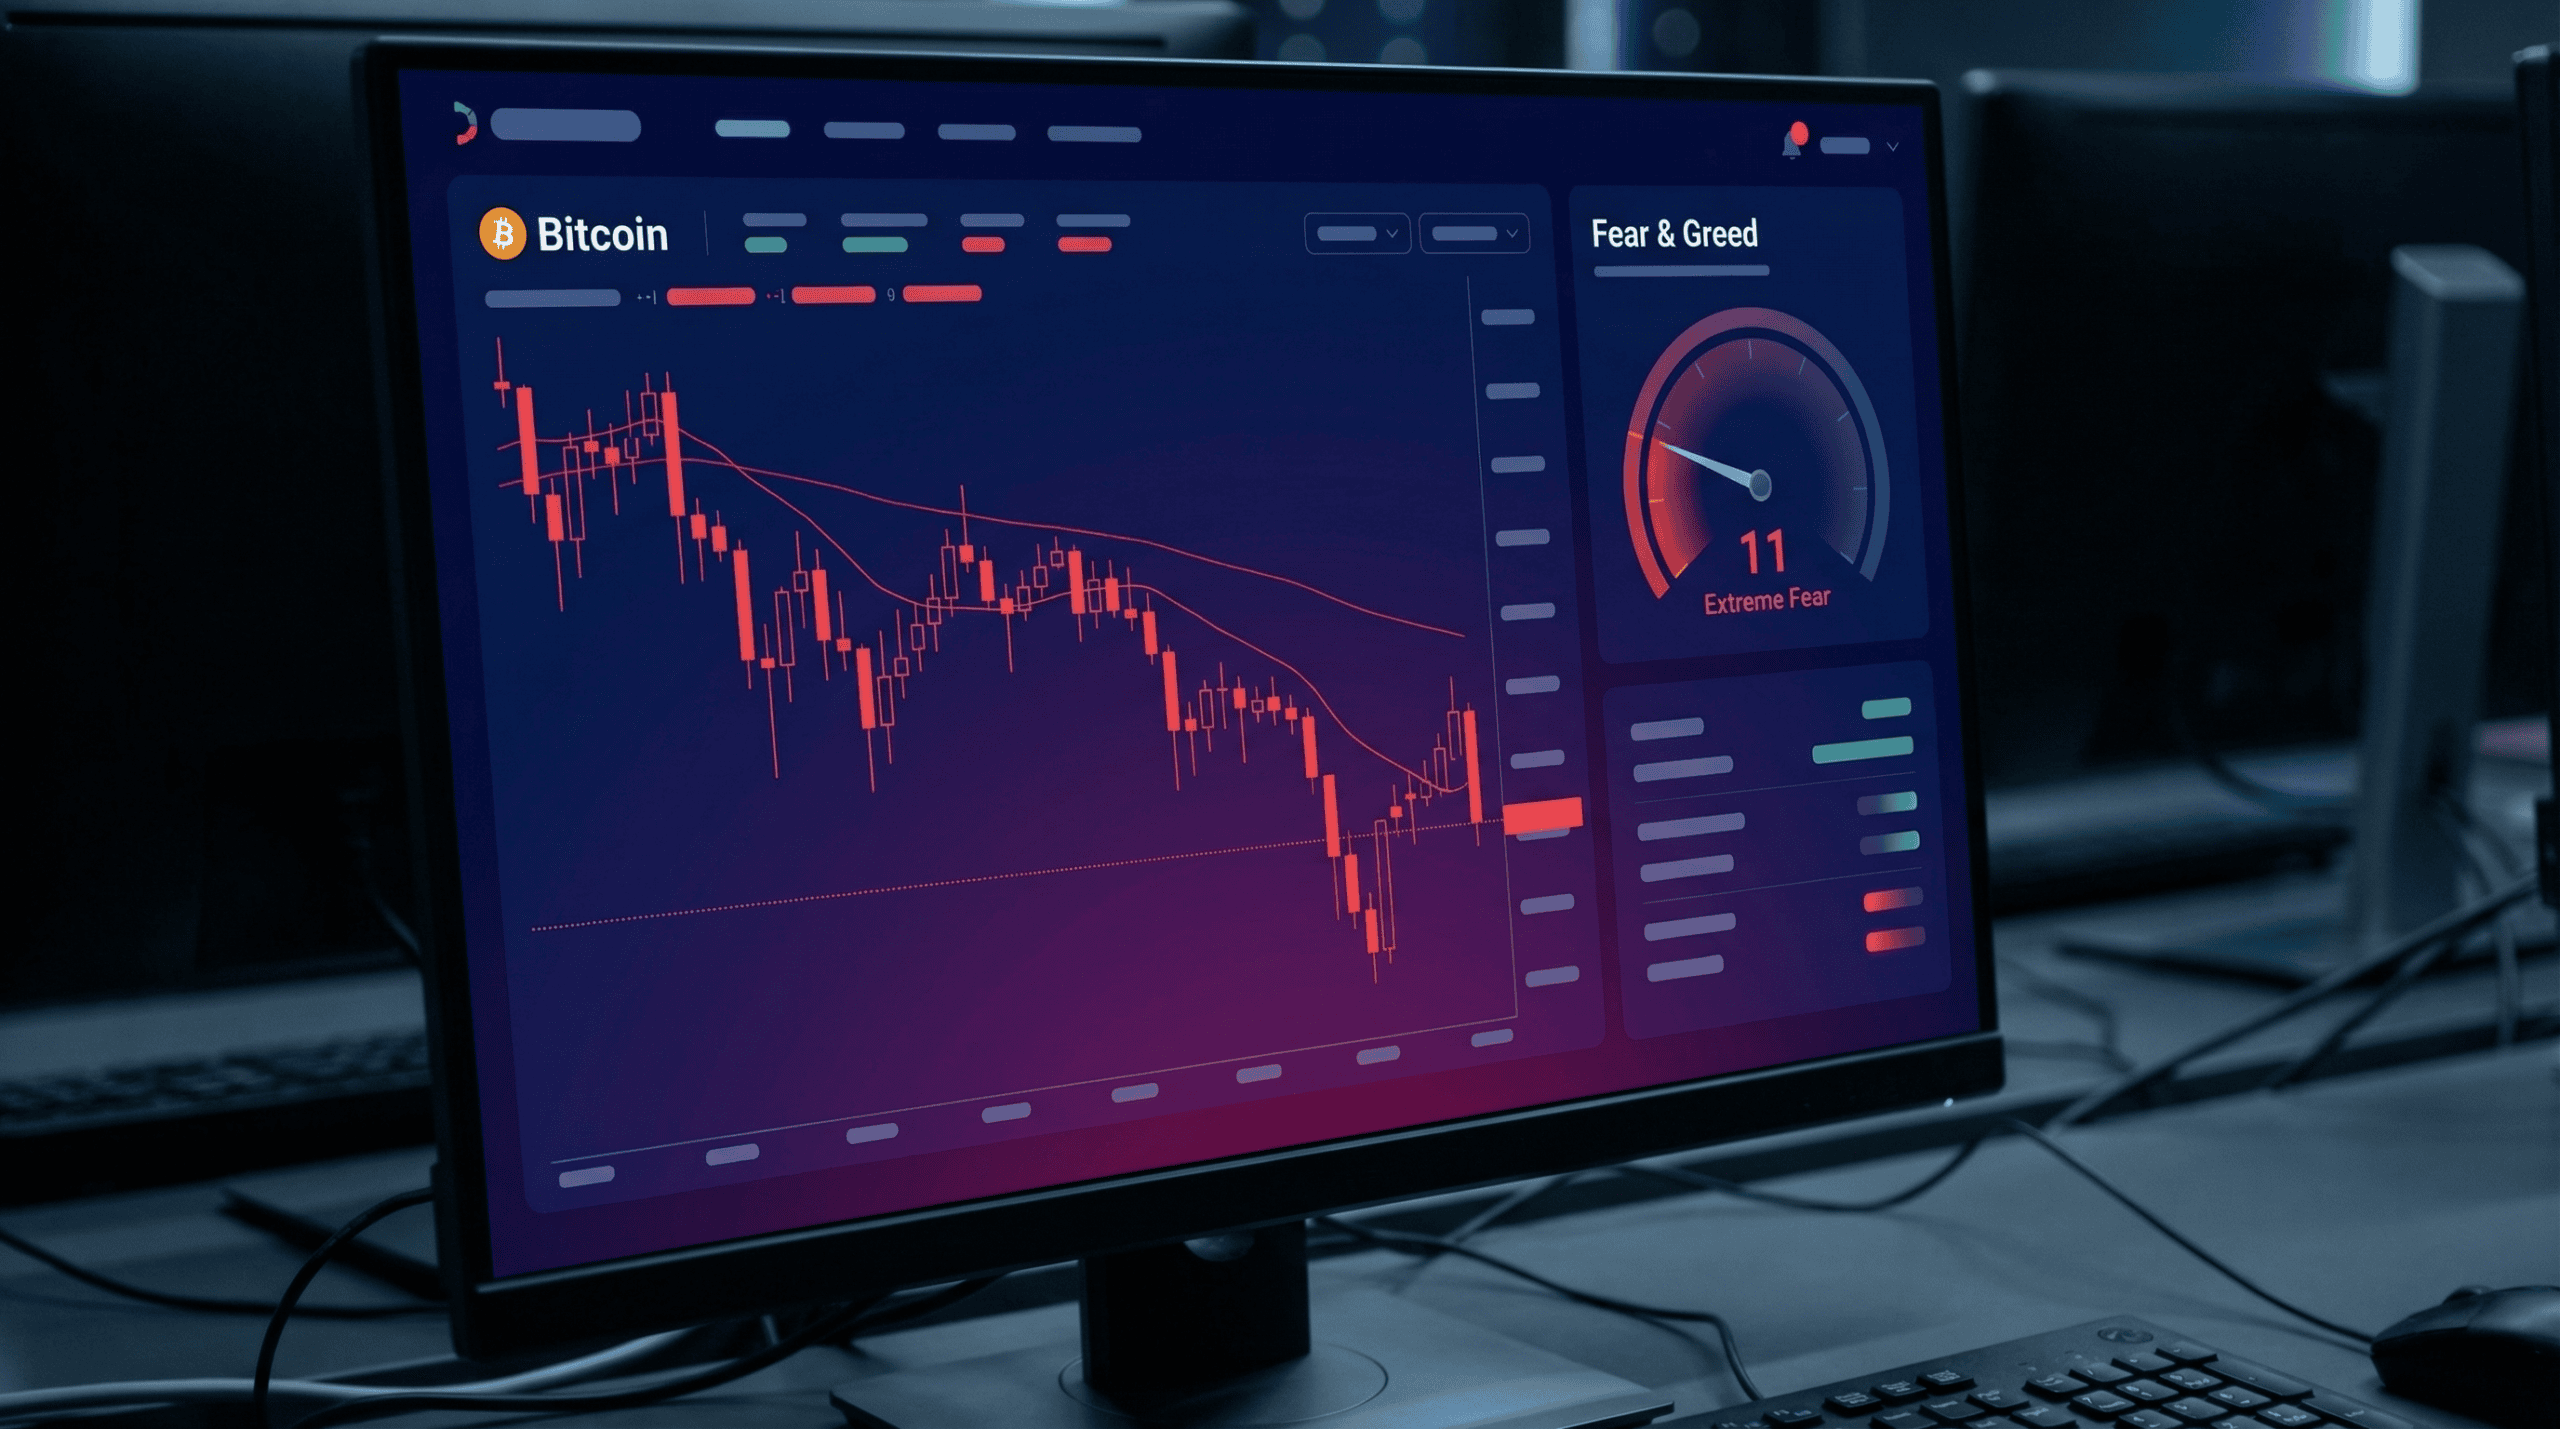
This crypto market weekly recap march 20 2026 covers a brutal week for Bitcoin and the broader market. BTC is finishing at $70,321, down roughly 15% from where it started Monday near $83,000. Ethereum sits at $2,140. Solana is at $89. XRP is holding $1.44. The Fear and Greed Index closed at 11 - Extreme Fear - for the third consecutive week.
This was not a clean technical correction. It was a bear market week shaped by macro forces that had nothing to do with on-chain fundamentals. Here is what actually happened, and why it matters more than most recaps will tell you.
Bitcoin's weekly crypto market recap: what moved prices
The week opened with BTC consolidating around $83,000 after a brief recovery the prior weekend. Monday was choppy but controlled. Then Wednesday happened.
Hot Producer Price Index data came in above expectations on Wednesday morning. Fed Chair Jerome Powell's subsequent comments signaled no rate cuts are coming soon. Within six hours, Bitcoin dropped from $79,500 to $71,800. Leveraged long positions got wiped out. According to data from derivatives trackers, over $455 million in long positions were liquidated across major exchanges that day alone.
The macro read is straightforward: when rate cut expectations die, risk assets bleed. Crypto bleeds faster than stocks because the leverage in the system is higher and the liquidity is thinner. Traders who used leverage without tight stops got hit hard.
Thursday brought a brief bounce to $74,000 before sellers returned Friday morning, pushing BTC back to the $70,000 range where it sits now.
Trading through volatility? Cut your fees first.
Bitunix offers some of the lowest futures fees in the market, plus up to $5,500 in welcome bonuses for new accounts.
Altcoin performance this week
The altcoin picture was worse than BTC's headline number suggests.

SOL dropped from roughly $105 to $89 - a 15% decline matching Bitcoin's pace. XRP moved from $1.66 to $1.44. ETH continued its streak of underperformance, falling from $2,290 to $2,140, and its ETH/BTC ratio touched multi-year lows. That ratio matters: when ETH loses ground against BTC in a sell-off, it usually means institutional capital is rotating out of alts entirely rather than just trimming positions.
Meme coins and low-cap alts fared worse. Several projects saw 25-40% drops with no news catalyst - just deleveraging pressure flowing down the risk curve from BTC to ETH to everything else.
For traders running smaller accounts, this week was a reminder that altcoin futures during macro sell-offs carry a different kind of risk than spot holds. Funding rates went deeply negative on many alt pairs, which actually created opportunities for short-sellers - but only if you had the positioning and the nerve to hold.
Why tariffs and rate policy kept hitting crypto all week
The Trump administration's ongoing tariff regime continues to weigh on global risk appetite. New 15% tariff announcements targeting European imports rattled equity markets early in the week. When S&P futures drop 1%, crypto tends to drop 3-4% because the investor bases overlap significantly and crypto lacks the circuit breakers that equity markets use.
The connection between trade war escalation and crypto prices is not theoretical at this point - it is something traders have had to price in every week since January. BTC started 2026 above $90,000. It has lost roughly a third of its value in under three months, with trade policy uncertainty and rate cut delays as the main culprits.
ETF flows reflected that institutional caution. According to CryptoQuant data, US Bitcoin ETFs - which were buying 46,000 BTC per week this time last year - are now net sellers in 2026. That reversal matters. The institutional bid that propped up prices through late 2025 is not there on the way down.
For a historical perspective on how these fear periods tend to resolve, the February Fear & Greed breakdown we covered is worth revisiting. The dynamics rhyme.
On-chain data: long-term holders are buying, short-term holders are selling
On-chain metrics tell a more nuanced story than the price chart alone.
Long-term holders (wallets holding BTC for 155+ days) increased their positions through the week. When experienced holders buy during Extreme Fear, it is not a guarantee of recovery, but it is meaningful context. These are not panic sellers - they are people who watched the 2018 and 2022 cycles and have a framework for what "cheap" looks like.
Short-term holders (less than 155 days) were selling at a loss throughout the week. The realized loss metric spiked Wednesday after the Powell remarks. This type of capitulation - where recent buyers exit at a loss - is one of the data points analysts use to identify bottoming patterns.
Weekly RSI on the BTC chart is sitting near 27. That is an oversold reading that has historically preceded major recoveries in prior cycles. That does not mean recovery is imminent - oversold can get more oversold - but it is the kind of data point that keeps long-term accumulators active at these levels.
Whale activity was quiet. Large wallets were not accumulating aggressively or distributing - they appeared to be waiting for clearer signals before committing. That waiting posture is itself informative: it suggests the market may need a macro catalyst (a rate cut signal, a trade war de-escalation, a strong earnings season) before institutional flows turn positive again.
Protect your positions with proper risk management.
Bitunix's isolated margin mode keeps losing trades from draining your whole account. New users get up to $5,500 to start.
What to watch next week
The $70,000 level is the number everyone is watching. BTC has tested and briefly broken below it twice this week before recovering. A sustained close below $70,000 would open a path toward the $63,000-$65,000 range that technical analysts have flagged as the next major support zone.
On the macro calendar, next week brings Fed meeting minutes and more commentary from regional Fed presidents. Any shift in language around rate policy could move markets quickly in either direction. Tariff developments remain unpredictable - the single biggest risk to any position right now is an unexpected policy announcement that either escalates or de-escalates trade tensions.
For traders who want a framework for navigating high-volatility periods, our guide on trading crypto futures during high volatility covers position sizing and stop placement in detail.
Tax season is also adding pressure. US holders who bought near the top in 2025 and are now sitting on losses are making decisions about whether to realize those losses before April 15. That tax-loss harvesting behavior can create unusual selling patterns in March - worth keeping in mind when looking at volume data.
Bottom line on this week's crypto market recap
This was a macro-driven week, not a crypto-specific one. The moves in BTC, ETH, SOL, and XRP tracked global risk-off sentiment almost exactly. The fundamentals of the networks did not change. What changed was the macro backdrop - rate cut expectations fell, tariff fears rose, and risk assets across the board sold off with crypto moving faster and harder than most.
Fear indexes at 11 have historically been good entry points over a 12-18 month horizon. They are terrible at telling you where the bottom is on any given day. Anyone who tells you they know exactly when this turns around is guessing. The data says long-term holders are buying, RSI is historically oversold, and ETF flows are the main missing piece. When those flows reverse, the recovery tends to move fast.
Until then: manage your liquidation risk, do not overleverage, and understand what you own before size matters.