

Crypto technical analysis is back in focus as traders try to make sense of a market that still feels cautious. Bitcoin is trading near $77,916, Ethereum is near $2,333, and the Crypto Fear and Greed Index sits at 33, which still reads as fear. That mix matters. Price is holding up better than sentiment, and that usually pushes traders back to the charts looking for cleaner entries, clearer invalidation levels, and signs that the next move has real conviction behind it.
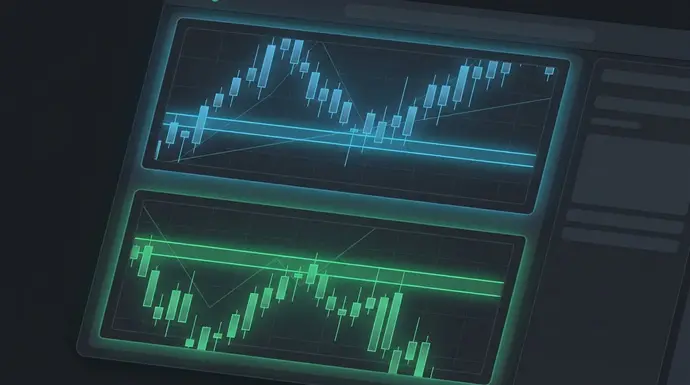
At its core, crypto technical analysis is the practice of reading market structure, momentum, and volume directly from the chart instead of relying only on headlines or narratives. It does not predict the future with certainty. What it does is help traders build a framework: where buyers have shown up before, where momentum is fading, and where risk stops making sense. In a market that trades around the clock and punishes hesitation, that framework is often the difference between a planned trade and a random click.
What crypto technical analysis actually measures
Crypto technical analysis starts with price. Every candle is a record of what buyers and sellers agreed on over a given period. From there, traders look for structure: higher highs and higher lows in an uptrend, lower highs and lower lows in a downtrend, and sideways ranges when neither side has taken control.
Support and resistance remain the first levels most traders map out. Support is the zone where buyers have stepped in before. Resistance is where rallies have stalled. On Bitcoin, for example, a trader might see repeated bounces from a prior demand zone and decide the level matters until price loses it decisively. On Ethereum, a failed push through a prior swing high can tell a very different story: momentum is there, but follow-through is not.
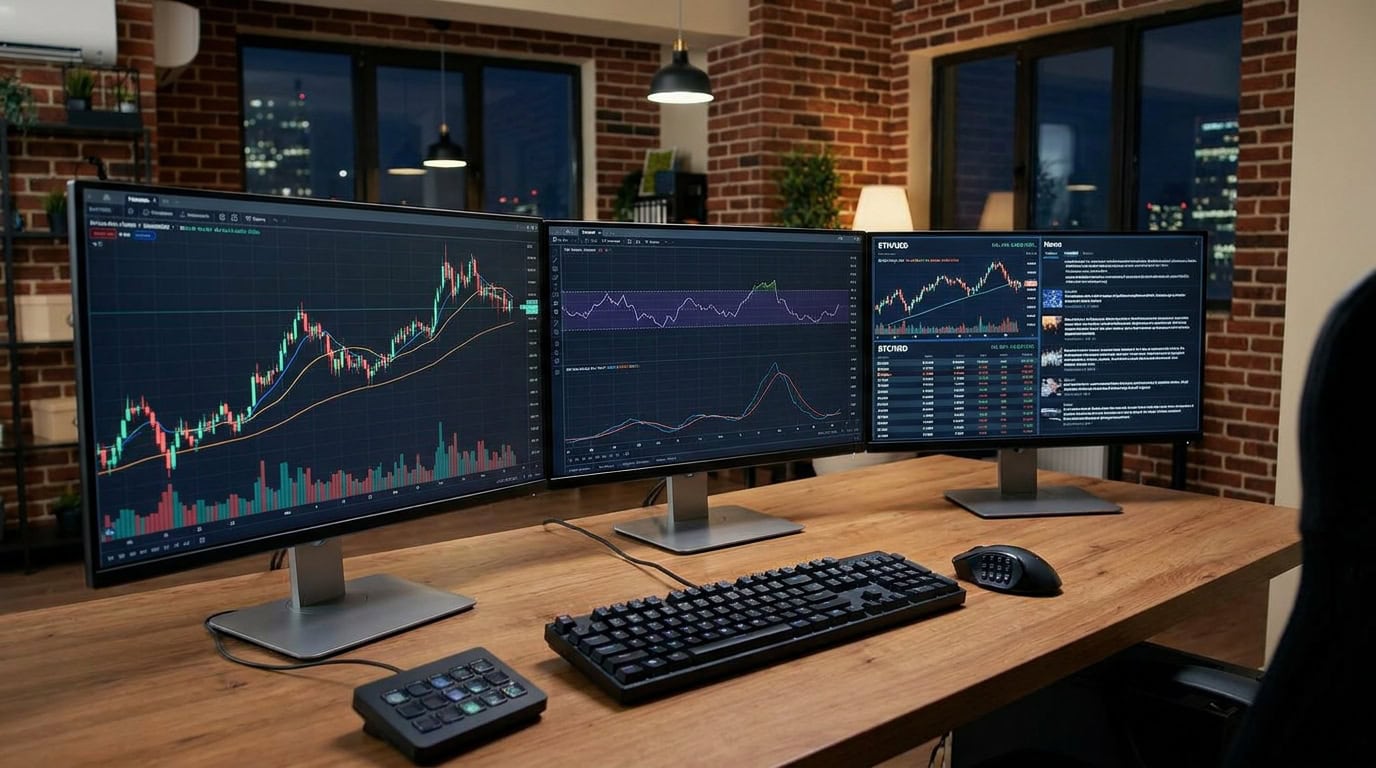
Most experienced traders combine raw structure with a small set of indicators instead of stacking ten tools on top of each other. Relative Strength Index, or RSI, is still widely used to gauge momentum and spot potential divergence. Moving averages help smooth out noise and show trend direction over time. Volume helps answer the question every breakout trader should ask: was that move real, or was it just a temporary squeeze in a thin market?
Trade cleaner setups with better execution
When crypto technical analysis gives you a clear level, Bitunix lets you act fast and claim up to $5,500 in bonus rewards.
Which crypto technical analysis tools traders use most in 2026
The most common crypto technical analysis setup in 2026 is still pretty simple. Traders watch a few major moving averages, mark horizontal support and resistance, check RSI for momentum, and use volume to judge whether a breakout has enough participation behind it. Simplicity survives because crypto moves fast, and overloaded charts slow down decision making.
Moving averages are useful because they create context. If Bitcoin is holding above a major daily moving average while the broader market is nervous, that can signal underlying strength. If price keeps losing the same average on each rebound, the trend may be weaker than social media suggests. RSI is often more useful when paired with structure. An RSI reading above 70 does not automatically mean short. In a strong trend, overbought conditions can persist. But if price is pressing into resistance while RSI makes a lower high, traders start paying attention.
Volume remains one of the most underappreciated filters. A breakout above resistance with weak volume is easy to fade. A breakout with expanding volume is harder to ignore because it suggests real participation. In perpetual futures markets, some traders also check funding rates and open interest alongside the chart. If price is rising while open interest climbs and funding gets crowded, that can hint at an overstretched move that needs a reset before it can continue.
How crypto technical analysis helps with real trade decisions
The practical value of crypto technical analysis is not in sounding smart. It is in forcing precision. Suppose Bitcoin has spent several sessions respecting a support band and then pushes back toward resistance. A trader can build an actual plan from that chart: entry near a reclaim, stop below the invalidation level, and a target near the top of the range. That is better than chasing a green candle because a large account on X posted a bullish thread.
Another example shows why trendlines still matter, even if they are less exact than horizontal zones. If Ethereum keeps printing higher lows against a flat ceiling, traders see a tightening structure. A breakout with rising volume may be worth taking. A breakdown below the trendline can tell you the pattern failed and risk should come off. The chart does not eliminate uncertainty, but it gives you a point where you are clearly wrong.
Altcoins add another wrinkle. Many of them look strong until Bitcoin loses momentum. That is why solid crypto technical analysis also includes market context. With fear still elevated at 33, traders are less likely to trust weak breakouts in smaller tokens. They want confirmation. They want cleaner levels. They want to know that if Bitcoin rolls over, the alt setup will not collapse in the next hour.
Common crypto technical analysis mistakes beginners keep making
The biggest mistake is treating indicators like signals instead of context. Beginners often think RSI alone can call tops and bottoms. It cannot. Others draw support and resistance on every candle wick until the chart becomes meaningless. A better approach is to focus on the levels that have produced obvious reactions and ignore the rest.
The second mistake is forgetting that risk management is part of crypto technical analysis, not separate from it. A clean setup without a stop is not a setup. It is hope. Traders who define risk before entry tend to last longer, especially in perpetual futures where leverage can turn a small error into a forced exit. If you need a refresher on position discipline, our guide to crypto futures position sizing breaks down how to size trades so one bad setup does not wreck the week.
The third mistake is ignoring market regime. Range strategies tend to fail when trend conditions take over, and breakout strategies get chopped up in flat markets. That is one reason traders keep returning to broader context tools like the altcoin season chart and the crypto fear and greed index. Those signals do not replace the chart, but they help explain why aggressive positioning sometimes works and sometimes gets punished fast.
How traders combine crypto technical analysis with risk management
Good traders do not ask whether crypto technical analysis works in isolation. They ask whether the setup offers acceptable risk for the potential reward. That is a healthier standard. A trade can be wrong and still be good if the loss was small and planned. A trade can be right and still be bad if it required reckless size or a missing stop.
In practice, that means defining invalidation before entry, sizing down when volatility expands, and resisting the urge to force trades when the chart is messy. It also means understanding the product you are trading. Spot positions, perpetual futures, and high-leverage altcoin trades behave differently. Traders trying to bridge that gap should read our breakdown of what perpetual futures are and our guide on how to avoid liquidation in crypto leverage trading.
Put your chart plan to work
Support, resistance, and risk rules matter more when you can size trades properly. New Bitunix users can claim up to $5,500 in bonuses.
Right now, the case for crypto technical analysis is simple. Sentiment is still shaky, but major assets are holding levels that matter. Bitcoin near $77,916 and Ethereum near $2,333 do not guarantee a breakout, but they do give traders structure to work with. In an uncertain tape, that is the point. The chart is not there to make you feel certain. It is there to help you act with a plan.