Crypto market weekly recap February 2026: Bitcoin's wild $6,000 swing and the SOTU silence
Bitcoin opened this week near $67,000, got dragged below $63,000 by Tuesday, then snapped back to nearly $69,000 by Wednesday in one of the sharpest short squeezes of the year. As of Friday morning, BTC trades at $66,276 - down 2.34% on the day and caught in a holding pattern ahead of a massive options expiry. This crypto market weekly recap February 2026 covers every major move: the tariff-driven selloff, Trump's conspicuous silence on crypto in his State of the Union address, five straight weeks of Bitcoin ETF outflows, and what today's $7.49 billion options expiry actually means for price.
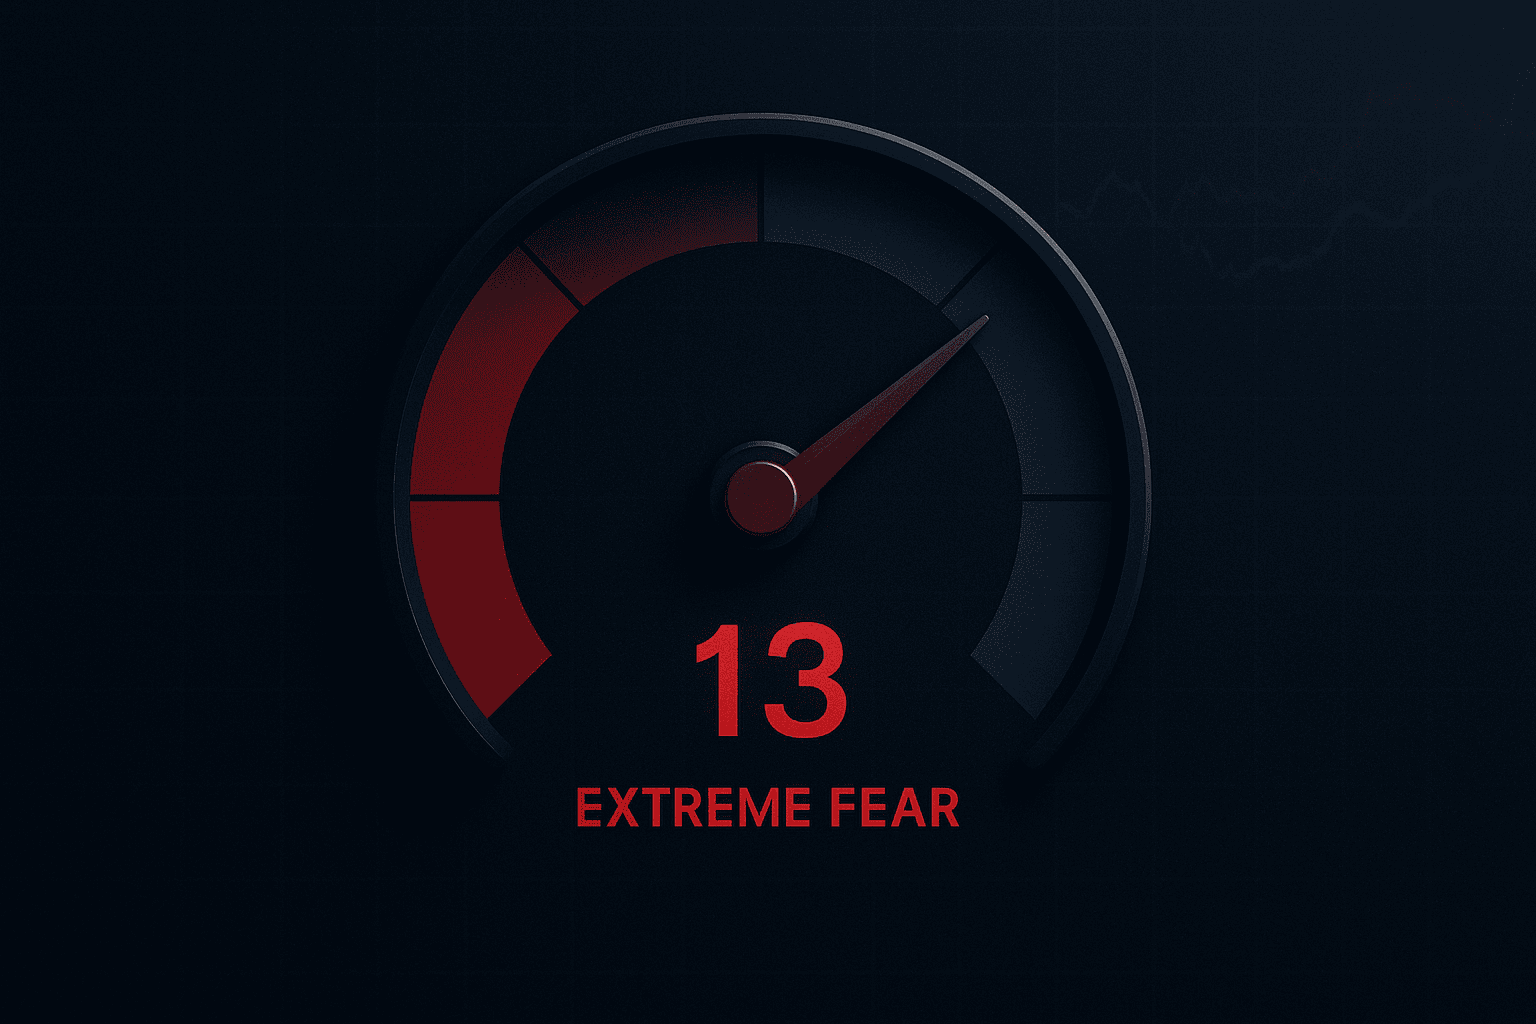
The Fear and Greed Index sits at 13 - extreme fear territory - for the third week running. That number tells the story before the chart does.
Bitcoin's crypto market weekly recap: the $63K crash and the 10% short squeeze
Tuesday was ugly. Bitcoin broke below $63,000 on a combination of tariff anxiety and fresh geopolitical pressure from Iran and the broader Middle East. CNBC described the move as "tactical de-risking" - the kind of phrase Wall Street uses when it wants to sound measured about panic selling.
But the shorts piled in too aggressively. By Wednesday, BTC ripped nearly 10% off its lows as leveraged short positions got liquidated in sequence. LMAX Digital strategist Joel Kruger said markets were "overdue for a technical bounce" given the heavy short bias that had built up over the prior week. He was right. The bounce was fast, violent, and entirely mechanical - not driven by new buyers stepping in, but by forced short covering.
That distinction matters. A bounce fueled by short liquidations tends to fade once the liquidation wave clears. Which is exactly what happened. By Thursday, the recovery stalled and BTC slid back below $67,000. Friday's print at $66,276 confirms it.
Resistance sits between $70,000 and $72,000. Bitfinex analysts identify the "True Market Mean" at $78,000 as the level Bitcoin must reclaim to signal a genuine trend reversal. Support at $60,000 is the floor traders are watching. Those are wide goalposts, and right now BTC is floating in the middle with no conviction either direction.
For traders trying to work this volatility without getting carved up, understanding how to size positions correctly is not optional. Our guide on trading crypto futures during high volatility covers the risk management mechanics in detail.
Trade the Volatility With Lower Risk
Bitcoin's $6,000 weekly swing is an opportunity if you manage risk well. New Bitunix users can earn up to $5,500 in bonuses to put that edge to work.
Trump's SOTU: the crypto president said nothing about crypto
Tuesday night, President Trump delivered his State of the Union address. It ran long - reportedly the lengthiest SOTU in recent memory. And in all that time, he mentioned crypto exactly zero times. No Bitcoin. No digital assets. No Strategic Reserve update.
This from the man who signed an executive order establishing a Bitcoin Strategic Reserve earlier in 2026. A New York Times opinion piece this week asked the question bluntly: "Donald Trump Is the Crypto President. Why Is It Struggling?"
The short answer is that executive enthusiasm and market performance are different things. The Strategic Reserve order generated headlines in January. It did not generate sustained institutional demand. Wednesday's risk-on bounce was broad - stocks, crypto, commodities all rallied together - suggesting it was driven by general sentiment, not any specific crypto catalyst.
The absence of crypto from the SOTU is notable precisely because Trump had every incentive to mention it. His political brand is tied to digital assets now. That he chose not to suggests either the administration is keeping its powder dry on further policy announcements, or that crypto is less central to the legislative agenda than markets priced in. Neither reading is bullish in the short term.
Five weeks of Bitcoin ETF outflows - and the numbers are getting worse
Bitcoin spot ETFs just logged their fifth consecutive week of net outflows. That equals the longest outflow streak since March 2025. Total 2026 outflows now stand at approximately $4.5 billion. Last week alone saw $479 million leave the funds.
CryptoQuant analysts put the figure in starker context: ETF outflows from October 2025 highs have now hit $8.3 billion. That is not a rounding error. That is sustained institutional selling, or at minimum, sustained institutional non-buying.
The ETF outflow story has been building for weeks. Bitcoin ETF outflows hit a five-week streak as the Fear Index dropped to 7 - and that was before this week's data pushed it lower still. The Fear and Greed Index now sits at 13. Earlier this month it briefly touched 5, a record low that coincided with Bitcoin's fourth straight red week.
The ETF outflow pattern suggests that the institutional investors who drove the 2024-2025 rally are reducing exposure, not adding. Whether that is profit-taking, risk-off rebalancing, or a fundamental reassessment of the asset class is hard to say. What is clear is that the inflow tide that once pushed BTC to $126,000 has reversed.
Options expiry, crypto stocks, and the altcoin bleed
Today, Friday February 27, approximately 115,000 BTC options worth $7.49 billion expire. The max pain price - the level where the most options expire worthless, causing maximum loss for options holders - is near $75,000, according to Wintermute OTC trader Jasper De Maere.
BTC at $66,276 is well below that max pain level. That gap does not automatically create upward price pressure in any mechanical sense, but it does tell you something about where the smart money was positioned heading into this expiry. A lot of bullish bets made earlier in the quarter are expiring underwater.
The Wednesday bounce did produce winners in the crypto equity space. Circle (CRCL) surged 34% after its earnings release. Coinbase (COIN) added 14%. Strategy (MSTR) gained 9%, and BitMine climbed 12%. These moves reflect genuine business momentum - Circle's earnings beat was real, not technical - but they also benefited from the broader risk-on day.
Altcoins gave most of that back. Ethereum trades at $1,962, down 4.9% on the week. Solana sits at $83, off 5.2%. XRP dropped to $1.37, a 4.83% decline. The pattern is consistent with what happens in bear market relief rallies: majors bounce harder, altcoins participate briefly, then resume their downtrends faster. Bitcoin's 52-week range of $60,074 to $126,198 tells the full story of this cycle's whipsaw character. Altcoins have generally seen even wider swings with less recovery.
For those thinking about how to position through the altcoin weakness, the Altcoin Season Index is worth revisiting - it provides a cleaner read on whether alts are leading or lagging BTC at any given moment, which matters a lot for rotation decisions.
Risk management in this environment is not a secondary concern. Our breakdown of crypto futures leverage and risk management addresses exactly how to size positions when volatility is this pronounced.
Options Expiry Week Is Behind Us - What's Your Next Move?
With $7.49B in options settling today, the next directional move could come fast. Start trading on Bitunix and claim up to $5,500 in welcome bonuses.
What comes next: key levels and the broader picture
The week ends with Bitcoin down roughly 1% from where it started, but the path there included a 6,000-dollar round trip. That volatility is not going away. The macro environment - tariff uncertainty, geopolitical friction, Federal Reserve ambiguity - is not resolving in the near term.
The levels are straightforward. Below $63,000 and the conversation shifts to whether $60,000 holds. Above $70,000 and the bulls can make a case for renewed momentum. Between those two prices - roughly where BTC is now - is range territory, which historically favors patient traders over aggressive directional bets.
The ETF outflow streak is the single most important data point to watch. Five consecutive weeks of institutional selling created this pullback. When those outflows stop, or reverse, that will be the first genuine signal that the trend has changed. Until then, the Fear and Greed Index at 13 is telling you exactly how most market participants feel right now.
Earlier in February, Bitcoin was already deep in recovery mode, attempting to reclaim $70,000 after a brutal selloff. The fact that it still has not closed convincingly above that level - weeks later - says something about the genuine difficulty of this recovery.